Skip to content

Community examples

What people got out of these datasets.

6 analyses that someone ran end to end on public NCI data, each one showing the numbers it produced and the trap it had to get past first. Every one is attached to the datasets it exercised, so it appears on their pages too. Add yours and it will.

The bar an example has to clear

A complete path, with the traps visible

01

Choose

Match the research question to measured data capability.

02

Retrieve

Use the repository API and state every required input.

03

Clean and check

Expose missingness, non-answers, joins and exclusions.

04

Analyze and verify

Produce interpretable outputs plus an execution receipt.

Shared so far

6 analyses you can run and adapt

Adapt the workflow, then recheck its assumptions for your own cohort.

Share your example
01beginnerpythonabout a minuteexecuted end to end

Which classes of analysis do this cohort's clinical records actually support, and which are ruled out before I request access?

Audit whether this dataset can answer your question

CD2S workbooks · ran 21 Sept 2026
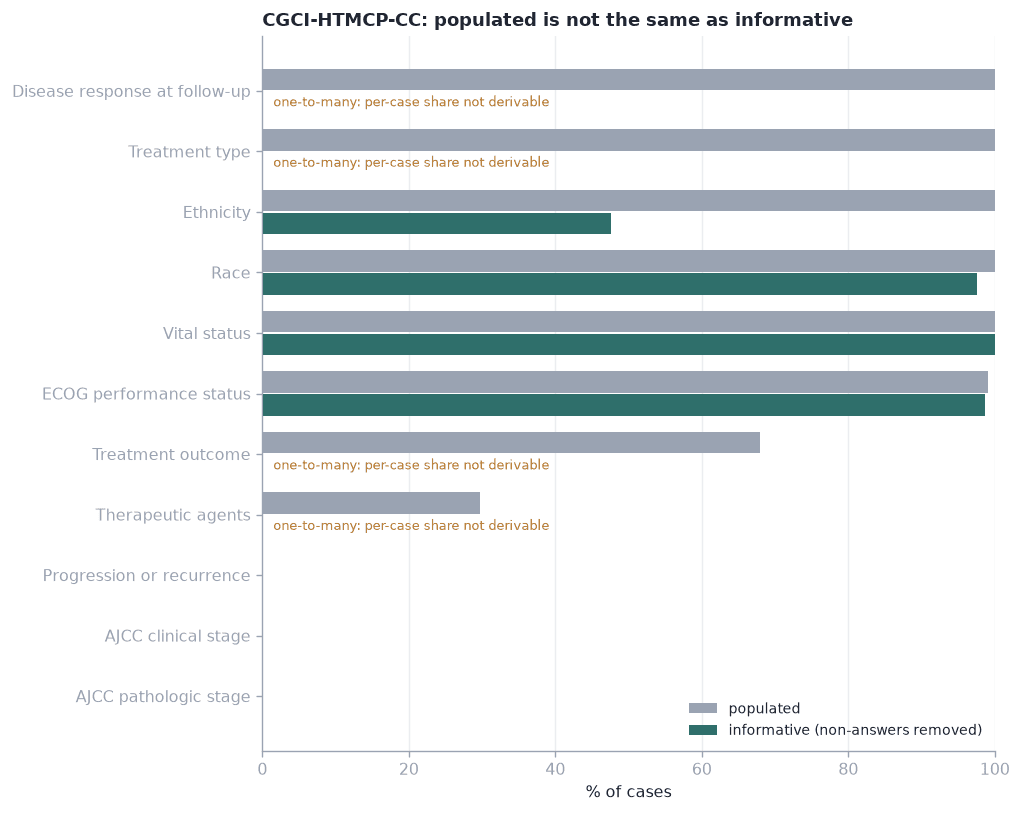
Horizontal bars for each probed clinical field, showing the share of cases the field is populated for against the smaller share that carries an informative value, with one-to-many fields marked as not derivable per case.
What it found when it ran
run of 21 Sept 2026
  • Four of the six analysis classes pass for CGCI-HTMCP-CC; stage-adjusted modelling and progression-free endpoints are blocked.
  • Vital status is informative for all 212 cases with 116 deaths, so an overall-survival endpoint is derivable.
  • Both stage fields and the progression field are informative for 0% of cases, which no case count can fix.
  • Four fields hold several records per case, so their per-case share cannot be inferred from a facet count at all.
The trap it prevents

A portal can list a field even when every value is an unusable non-answer.

What you leave with

Decide whether the analysis is possible before requesting data or writing a protocol.

Workflow
  1. 1Fetch project summary and per-assay case counts
  2. 2Request facet counts for the clinical fields that gate common analyses
  3. 3Separate absent fields from fields populated with non-answers
  4. 4Flag one-to-many fields where per-case percentages cannot be inferred
  5. 5Retrieve case-level fields and test whether a survival endpoint is derivable
  6. 6Print a verdict for each analysis class
Outputs you can inspect
  • Per-field coverage table separating populated from informative values
  • Assay coverage as a percentage of the cohort
  • A yes/no verdict for six common analysis classes
  • A chart contrasting populated with informative coverage, field by field
02beginnerpythonabout two minutesexecuted end to end

Which molecular and clinical factors are associated with survival?

Overall survival from open data, with the endpoint derived correctly

CD2S workbooks · ran 21 Sept 2026
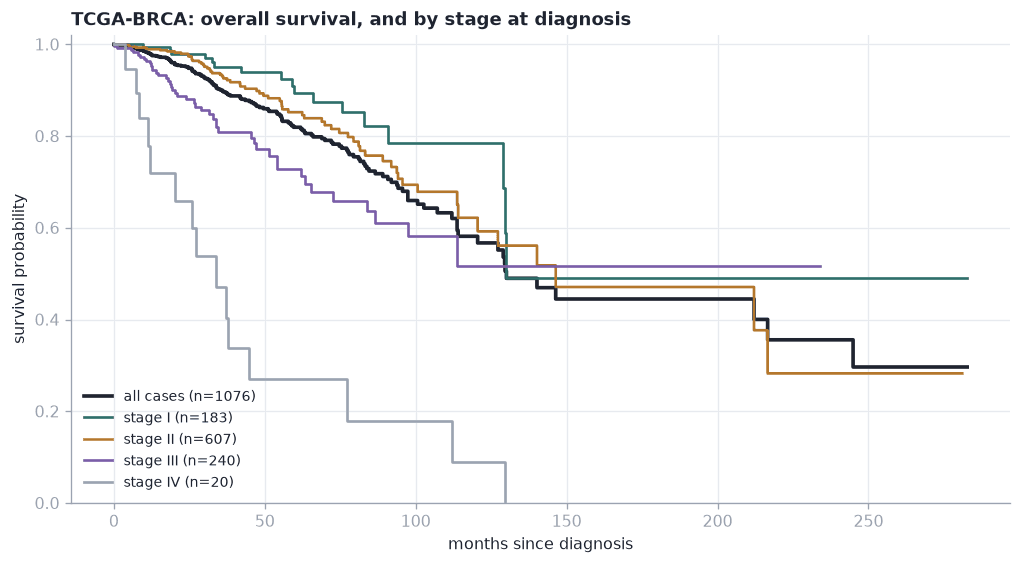
Kaplan-Meier survival curves against months since diagnosis: one curve for the whole cohort and one per stage group, showing separation between stages and how thin the long follow-up becomes.
What it found when it ran
run of 21 Sept 2026
  • 1,076 of 1,098 cases carry a usable endpoint - 150 deaths, 926 censored, median follow-up 25.6 months among the censored.
  • Survival is 97.9% at 12 months, 89.8% at 36 and 81.9% at 60.
  • Stage I against stage IV separates sharply - log-rank p = 8.1e-18 on 183 against 20 cases.
  • The Cox model fits 1,050 cases with 141 events and reaches concordance 0.746; stage IV carries a hazard ratio of 10.6.
The trap it prevents

Survival time is split across three fields and includes sentinel values that look numeric.

What you leave with

Derive a defensible endpoint, account for exclusions, then fit and interpret the model.

Workflow
  1. 1Retrieve case-level clinical fields including all three follow-up locations
  2. 2Derive time and event, guarding against GDC sentinel values
  3. 3Report how many cases are dropped and why
  4. 4Fit Kaplan-Meier and a stage-stratified log-rank test
  5. 5Fit a multivariable Cox model adjusting for age and stage
Outputs you can inspect
  • Kaplan-Meier estimates with survival at 12, 36 and 60 months
  • Log-rank test between stage groups
  • Multivariable Cox model with concordance
  • A Kaplan-Meier plot of overall survival, stratified by stage at diagnosis
See it on real datasets
03intermediatepythonabout a minuteexecuted end to end

Is performance status associated with response to chemoradiation, and which agents were actually given?

Treatment response, after checking the response field is real

CD2S workbooks · ran 21 Sept 2026
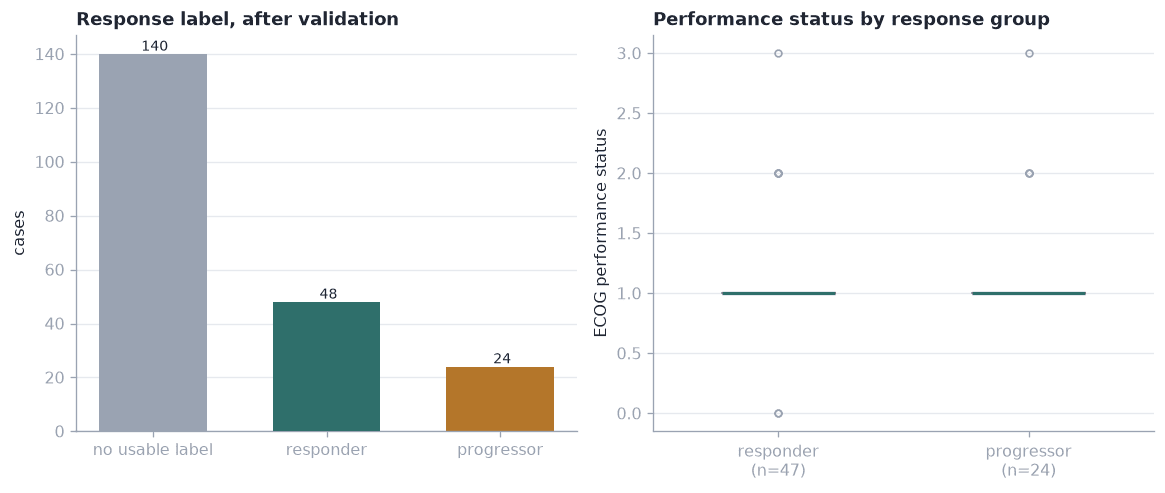
Two panels: a bar chart of how many cases carry each response label against how many carry none, and box plots of ECOG performance status for responders against progressors.
What it found when it ran
run of 21 Sept 2026
  • Only 72 of 212 cases carry a usable response label: the follow-up field holds disease status, not response.
  • ECOG does not separate responders from progressors - Mann-Whitney p = 0.30, median 1 in both groups.
  • Cisplatin is recorded for 60 cases and paclitaxel for 35, but some agent is named for only 63 of 212.
The trap it prevents

Disease-status codes and true response categories are easy to mix into one misleading outcome.

What you leave with

Validate the response field, collapse repeated records, and state what the observational result cannot prove.

Workflow
  1. 1Facet the two response-bearing fields and classify their values
  2. 2Collapse one-to-many treatment records to one label per case
  3. 3Compare performance status between response groups
  4. 4Tabulate the therapeutic agents actually recorded
Outputs you can inspect
  • Separation of genuine response categories from disease-status codes
  • Per-case responder/progressor labels under a stated rule
  • Mann-Whitney comparison of ECOG between response groups
  • Agent frequency table
  • A two-panel chart of response composition and ECOG by response group
04intermediatepythonabout a minuteexecuted end to end

Where can I find ubiquitylome, lipidome or metabolome data, and which cohorts carry several scarce layers on the same tumors?

Find and use the scarcest measurements in the portfolio

CD2S workbooks · ran 21 Sept 2026
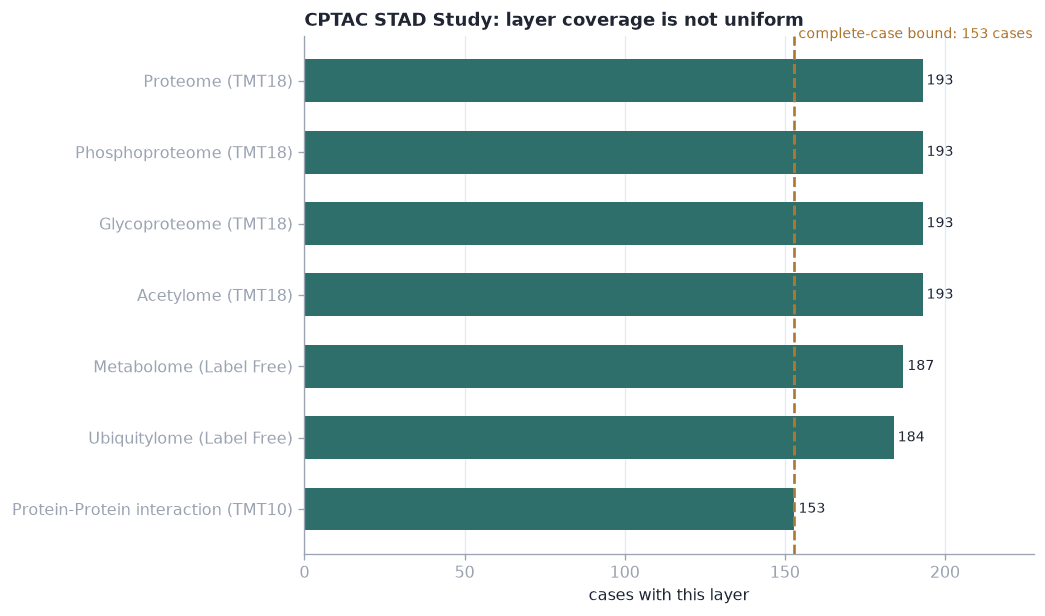
Horizontal bars of the case count for each measured layer in the target cohort, with a dashed line at the smallest layer marking the ceiling on any analysis needing every layer at once.
What it found when it ran
run of 21 Sept 2026
  • Across 255 PDC studies the proteome appears 109 times, the ubiquitylome 5 and the lipidome 3.
  • CPTAC STAD carries five scarce layers on 193 cases, but a complete-case analysis across all seven is capped at 153.
  • Each of the six STAD accessions returns one article, so accession tracing is blind to proteomic reuse.
The trap it prevents

Rare proteomic layers are scattered across study records and may cover different patients.

What you leave with

Find genuinely scarce measurements and bound the complete-case cohort before designing the study.

Workflow
  1. 1Enumerate every PDC study through the public GraphQL endpoint
  2. 2Rank analytical fractions by number of studies
  3. 3Group per-fraction studies back into biological cohorts
  4. 4Report the per-layer case counts that bound a complete-case analysis
  5. 5Query Europe PMC for each accession to show citation tracing is blind here
Outputs you can inspect
  • Scarcity ranking of every analytical fraction
  • Cohorts carrying two or more scarce layers
  • Layer overlap bounding a complete-case analysis
  • Citation counts demonstrating that PDC accessions are not quoted
  • A chart of per-layer coverage with the complete-case ceiling marked
See it on real datasets
05advancedpythonabout two minutesexecuted end to end

Which cohorts have both imaging and molecular data on the same patients, and how many patients actually carry both?

Join the same patients across two NCI repositories

CD2S workbooks · ran 21 Sept 2026
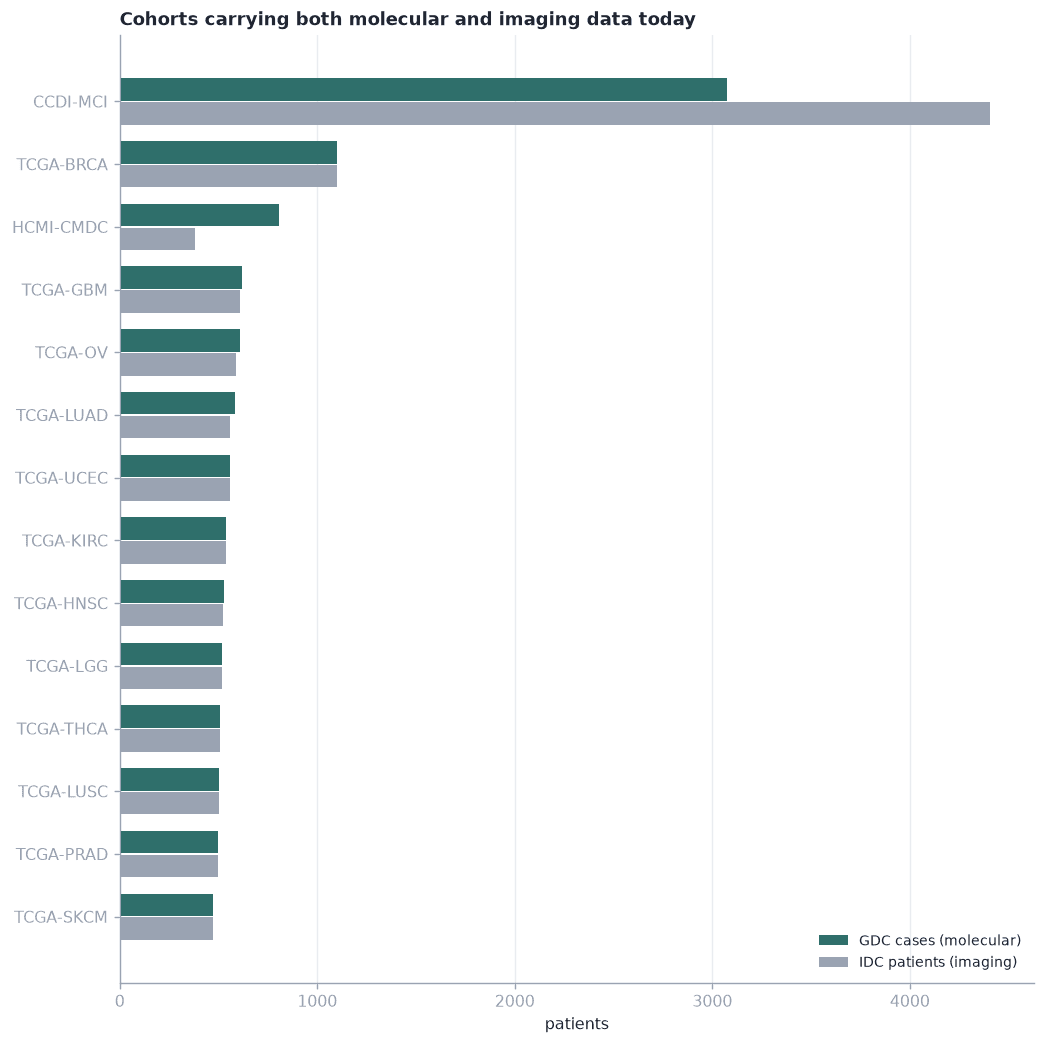
Paired horizontal bars per cohort comparing GDC molecular case counts with IDC imaging patient counts, where the shorter bar is the ceiling on a multimodal study of that cohort.
What it found when it ran
run of 21 Sept 2026
  • All 1,098 TCGA-BRCA patients appear in both the GDC and the IDC, a 100% join with nothing imaging-only.
  • 39 cohorts exist in both repositories, covering 15,761 patients.
  • HCMI-CMDC holds 805 molecular cases but 382 imaging patients, so its multimodal ceiling is 382, not 805.
The trap it prevents

Molecular and imaging data for the same cohort live in separate NCI repositories.

What you leave with

Join shared patient identifiers and quantify the real multimodal overlap, not the advertised totals.

Workflow
  1. 1Retrieve patient identifiers from the GDC project
  2. 2Query IDC's public SQL endpoint for the collection's patient identifiers
  3. 3Intersect on the shared barcode and quantify the overlap
  4. 4Sweep every GDC project against every IDC collection
Outputs you can inspect
  • Patient-level intersection between a GDC project and an IDC collection
  • Counts of molecular-only, imaging-only and joined patients
  • A map of every cohort present in both repositories
  • A chart comparing molecular and imaging patient counts per linkable cohort
06advancedpythonunder a minuteexecuted end to end

Given a research goal, which dataset should an agent choose, and what must it refuse to do with it?

Select a dataset the way an agent should

CD2S workbooks · ran 21 Sept 2026
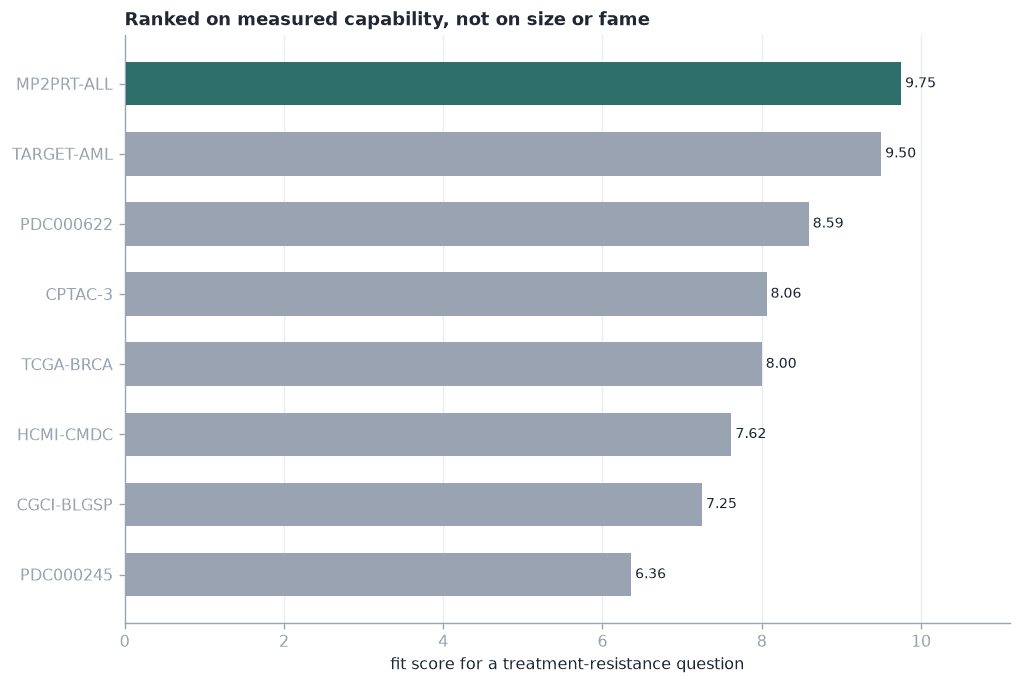
Horizontal bars of the fit score for each shortlisted dataset, with the selected cohort highlighted, showing whether the ranking is decided by overall fit or by one dominant term.
What it found when it ran
run of 21 Sept 2026
  • A size-ranked agent picks msk_ch_2023 and its 42,714 cases, which record neither treatment response nor a survival endpoint.
  • Only 51 of 602 datasets record both, measured from field coverage rather than description.
  • Ranking on fit selects MP2PRT-ALL - 1,510 cases, 100 months of follow-up - and carries its 4 major limitations into the brief.
The trap it prevents

Ranking by size or fame can select a large dataset that cannot answer the question.

What you leave with

Filter on measured capability, rank on fit, and carry blocking limitations into the analysis brief.

Workflow
  1. 1Load the structured index
  2. 2Show what a naive size-ranked selection returns
  3. 3Filter on measured capability rather than description
  4. 4Rank on fit, rewarding under-used datasets
  5. 5Read blocking limitations from the full record
  6. 6Emit a task brief including what the agent must not do
Outputs you can inspect
  • Contrast between a size-ranked and a capability-ranked selection
  • A transparent fit score favoring under-used resources
  • Blocking limitations read before committing
  • A machine-readable task brief for the next step
  • A chart of the ranked fit scores with the selected cohort highlighted
See it on real datasets